

By Demion McTair. Updated 5:55 a.m., Thursday, September 1, 2022, Atlantic Standard Time (GMT-4).
Editorial: The purpose of the article is neither to support nor oppose an increase in salaries for public servants.
This fact-based article is simply to bring context to the salary increase discussion in the country in the wake of rising cost of living.
Every discussion is made more worthwhile if those involved have the facts. The facts can only strengthen the discussion on whichever side one finds him/herself on the issue.
With the sustained increase in the cost of living in St. Vincent and the Grenadines, and the world over, it is no surprise that workers and their unions are calling for salary/wage increases.
The Public Service Union and the SVG Teachers’ Union announced on August 31 that they are scheduled to have talks with the finance minister on September 6, to discuss the Unions’ proposals to curb the rising cost of living, one of which is to increase salaries by 10 percent.
Here is a history of salary/wage increases for public sector workers and other notable benefits since 2002 – two decades ago, to present – 2022. A brief summary of the economic situation in the country in each year is also provided.
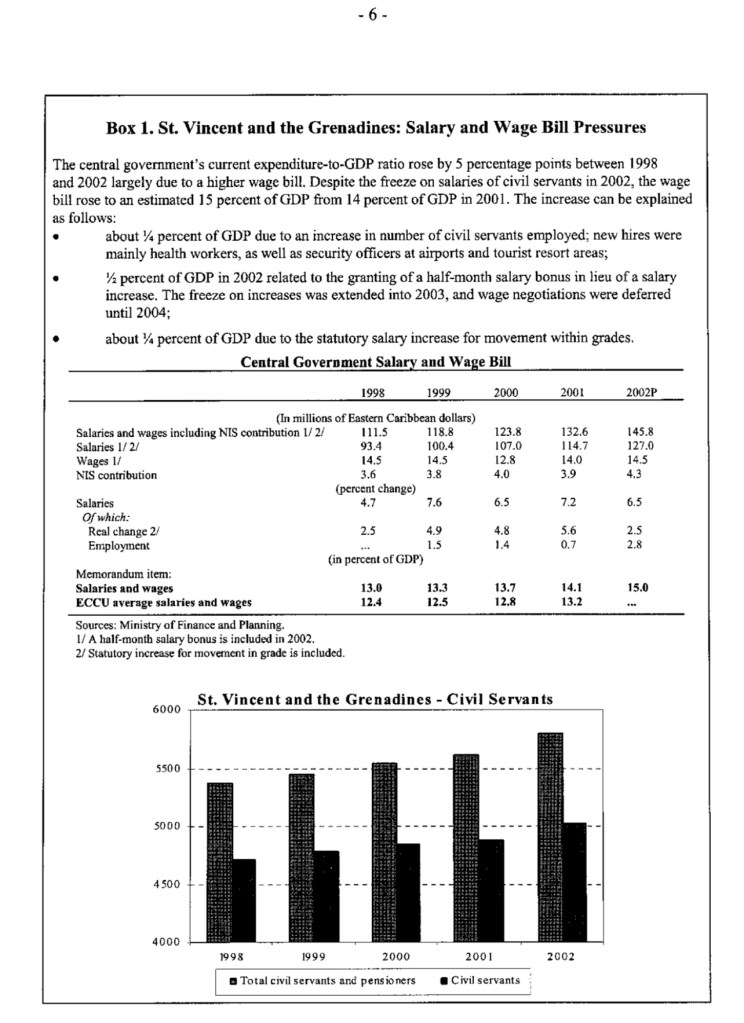
2002: a one-time payment of 4.25% of monthly salaries was paid out by the government.
In 2002, St. Vincent and the Grenadines recorded 1.7 percent real growth. Source: 2005 Budget Address.
According to the International Monetary Fund – IMF, the wage bill was concerning.
2003: There was no increase in salaries.
In 2003, St. Vincent and the Grenadines had 3.6 per cent real growth. Source: 2005 Budget Address.
According to the IMF, “Real GDP grew more rapidly than anticipated in 2003, while inflation was also higher. Preliminary national accounts estimates indicate real GDP growth of 3.6 percent in 2003, 2 percentage points higher than previously estimated. The strong growth outcome stems from increased activity in the electricity, construction, and trade and transport sectors.” The 2006 National Budget stated that real growth was at 3.4 percent.
The IMF said: “The 12-month CPI inflation increased to 2.7 percent (projected inflation was 1.5 percent), largely on account of a sharp increase in food prices in the last three months of the year.”
2004: There was a 4% increase in salaries across the board.
In 2004, real growth of 5.4 percent was recorded. Source: 2006 Budget Address. The World Bank has the figure at 4.1 percent.
According to the SVG Statistical Office, inflation in 2004 was 2.87 percent.
2005: There was a 3 percent salary increase. This was an election year.
There was real growth (Gross Domestic Product – GDP) of 2.5 percent in 2005, according to the World Bank.
According to the SVG Statistical Office, inflation in 2005 was 3.45 percent.
2006: There was a 4.5 percent salary increase.
There was growth of 7 percent in 2006, according to the World Bank.
According to the SVG Statistical Office, inflation in 2006 was 3 percent.
2007: There was a 5 percent salary increase. This was the year the fixed Value Added Tax – VAT replaced the variable Consumption Tax on goods and services.
According to the IMF, real growth stood at approximately 7 percent in 2007.
This was also the year the Ottley Hall debt write-off took place. According to the IMF 2007 report, published in 2008, “An agreement with Italy to write-off the Ottley Hall debt obligation has reduced St. Vincent and the Grenadines’ public debt stock by about 10 percent of GDP. The loan had been serviced by the Italian export agency, due to perceived malfeasance by the private builder-operator. The write-off, formalized in October 2007, will lower the debt to-GDP ratio to around 68 percent by end-2007.”
According to the SVG Statistical Office, inflation in 2007 was 6.96 percent.
2008: There was a 5 percent salary increase. This was the year the global financial crisis began to take effect.
There was growth of 0.4 percent in 2008, according to the World Bank. In the 2011 National Budget, the 2008 negative growth was recorded at -0.2 percent.
According to the SVG Statistical Office, inflation in 2008 was 10.1 percent.
2009: There was a 3 percent salary increase.
There was real negative economic growth (Gross Domestic Product – GDP) of -1.4 percent in 2009, according to the World Bank.
According to the SVG Statistical Office, inflation in 2009 was 0.4 percent.
2010: There was a 3 percent salary increase. This was the year of hurricane Tomas. This was also an election year.
There was real negative economic growth (Gross Domestic Product – GDP) of -4.3 percent in 2010, according to the International Monetary Fund – IMF. The World Bank records this negative growth at -4.5 percent.
According to the SVG Statistical Office, inflation in 2010 was 0.7 percent.
2011: There was a 3 percent salary increase. This was the year of the April freak floods.
There was real negative economic growth (Gross Domestic Product – GDP) of -0.6 percent in 2011, according to the World Bank.
According to the SVG Statistical Office, inflation in 2011 was 3.2 percent.
2012: There was a retroactive payment of 1.5 percent salary increase.
There was real economic growth (Gross Domestic Product – GDP) of 1.2 percent in 2012, according to the World Bank.
According to the World Bank Development Indicators data, inflation in St. Vincent and the Grenadines in 2012 was 2.59 percent. This figure was also reported by the SVG Statistical Office.
2013: There was a retroactive payment of 1.5 percent salary increase. This was the year of the December 24th freak floods.
There was real economic growth (Gross Domestic Product – GDP) of 2.5 percent in 2013, according to the World Bank.
According to the World Bank Development Indicators data, inflation in St. Vincent and the Grenadines in 2013 was 0.8 percent. This figure was also reported by the SVG Statistical Office.
2014: There was no salary increase.
There was real economic growth (Gross Domestic Product – GDP) of 1.1 percent in 2014, according to the World Bank.
According to the World Bank Development Indicators data, inflation in St. Vincent and the Grenadines in 2014 was 0.19 percent. This figure was also reported by the SVG Statistical Office.
2015: There was a 2.5 percent salary increase. This was an election year.
There was real economic growth (Gross Domestic Product – GDP) of 2.8 percent in 2015, according to the World Bank.
According to the World Bank Development Indicators data, inflation in St. Vincent and the Grenadines in 2015 was -1.7 percent. This figure was also reported by the SVG Statistical Office.
2016: There was a 1.5 percent salary increase.
There was real economic growth (Gross Domestic Product – GDP) of 4.1 percent in 2016, according to the World Bank.
According to the IMF, consumer inflation was low near 1 percent in 2016. According to the World Bank Development Indicators data, inflation in St. Vincent and the Grenadines in 2016 was -0.14 percent. This figure was also reported by the SVG Statistical Office.
The wage bill increased in 2016 “after civil servants received salary raises at end-2015 and January 2016,” the IMF reported.
2017: There was no salary increase. This was the year the Argyle International Airport was commissioned (became operational).
There was real economic growth (Gross Domestic Product – GDP) of 1.7 percent in 2017, according to the World Bank.
According to the IMF, consumer inflation reached 1.9 percent y-o-y in September 2017, reflecting increases in the VAT and minimum wages. According to the World Bank Development Indicators data, at the end of 2017, inflation in St. Vincent and the Grenadines was 2.15 percent. This figure was also reported by the SVG Statistical Office.
The wage bill remained above 13 percent of GDP in 2017 “with the recruitment of new police officers and medical personnel,” the IMF reported.
2018: There was a 1 percent salary increase which took into account the period of July to December.
There was real economic growth (Gross Domestic Product – GDP) of 3.1 percent in 2018, according to the World Bank.
According to the World Bank Development Indicators data, inflation in St. Vincent and the Grenadines in 2018 was 2.3 percent. This figure was also reported by the SVG Statistical Office.
2019: There was a 1.5 percent salary increase. There was a boom in tourism this year.
There was real economic growth (Gross Domestic Product – GDP) of 0.4 percent in 2019, according to the World Bank.
According to the World Bank Development Indicators data, inflation in St. Vincent and the Grenadines in 2019 was 0.91 percent.
2020: There was a 2 percent salary increase. This was the year the Covid-19 pandemic began. This was also an election year.
There was real negative growth (a decline in Gross Domestic Product – GDP) of -5.3 percent in 2020, according to the World Bank.
According to the World Bank Development Indicators data, inflation in St. Vincent and the Grenadines in 2020 was -0.6 percent. This figure was also reported by the SVG Statistical Office.
2021: No recorded salary increase. Covid-19 and the La Soufrière volcanic eruptions featured heavily in this year.
There was real economic growth (Gross Domestic Product – GDP) of 0.7 percent in 2021, according to the World Bank.
According to the World Bank Development Indicators data, inflation in St. Vincent and the Grenadines in 2021 was 1.5 percent. This figure was also reported by the SVG Statistical Office.
2022: No recorded salary increase.
Other notable benefits:
Re-classification:
During this process, a number of public servants received increased salaries because their positions were upgraded. Added to reclassification were increments earned by all public servants, in the various salary bands, amounting to another salary increase.
Tax reform:
In 2018, the government implemented tax reform. Personal and company taxes (rates) were moved from 40% to 30% and (29%) for hotels. The taxable income threshold for workers was moved from $12,000 annually to $16,000, and in 2010, to $20,000. Once someone is earning $1600 or less, no tax is charged on his/her income.
Similarly, for businesses, the threshold for VAT registration was moved from $120,000, annually, to $300,000 to provide relief for small businesses.

1 comment